Choosing between air and sea freight for hat shipments involves more than comparing basic transportation rates. The true cost calculation must account for hidden expenses, time value, inventory carrying costs, and market dynamics that significantly impact total landed costs. For hat manufacturers and retailers, understanding these comprehensive calculations can mean the difference between profitability and unexpected losses.
The true cost comparison between air and sea freight for hats encompasses transportation charges, inventory carrying costs, capital tie-up duration, obsolescence risk, and market opportunity costs. While sea freight typically offers lower per-unit transportation costs, air freight provides advantages in speed-to-market, reduced inventory holding, and better responsiveness to fashion trends. A thorough analysis requires examining both quantitative and qualitative factors specific to the headwear industry.
This comprehensive guide breaks down the actual cost components for both shipping methods, providing a framework for making informed logistics decisions that align with your business strategy and market requirements.
What Are the Direct Transportation Cost Components?
Direct transportation costs form the foundation of any freight comparison, but understanding the complete picture requires looking beyond basic carrier quotes. Both air and sea freight involve multiple cost layers that can significantly impact total expenses.
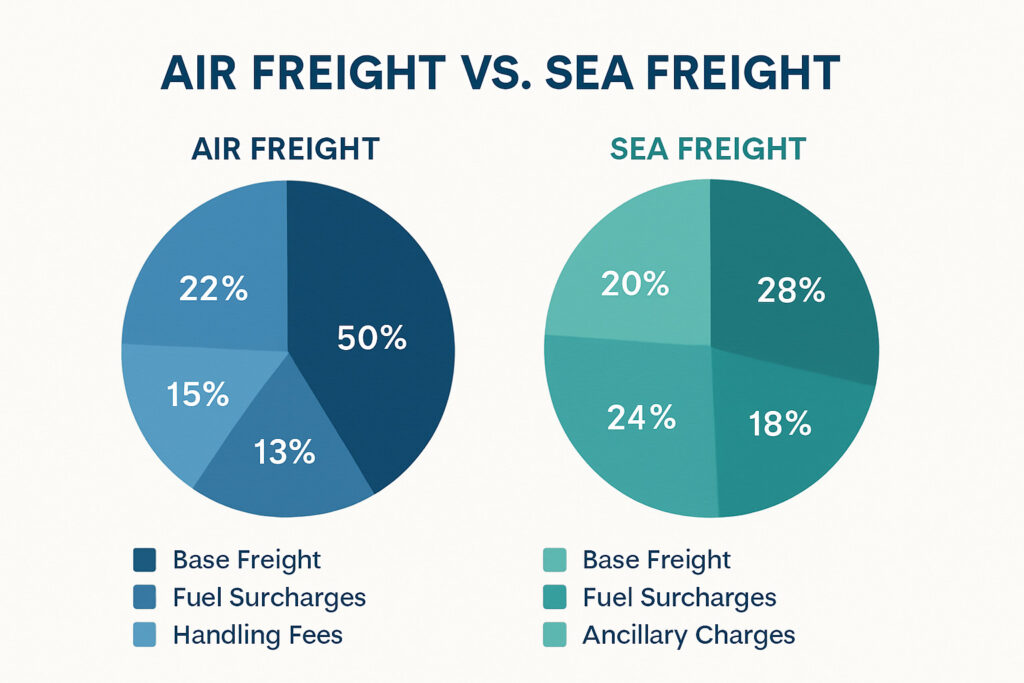
The actual transportation expense includes base freight charges, fuel surcharges, security fees, terminal handling charges, and various accessorial costs that vary by shipping method and route. Each mode has unique cost structures that behave differently as shipment parameters change.
How Do Base Freight Rates Compare?
Air freight rates typically range from $4-8 per kilogram for hat shipments, with rates fluctuating based on seasonal demand patterns and capacity availability. Sea freight rates generally cost $800-2,500 per 20-foot container, translating to approximately $0.15-0.45 per hat depending on packing density. The weight-to-volume ratio significantly impacts air freight costs, as hats typically ship as volume weight rather than actual weight. Sea freight becomes increasingly cost-effective at volumes above 5,000 units, while air freight maintains cost consistency across various shipment sizes. Understanding these fundamental rate structures provides the baseline for deeper cost analysis.
What Surcharges and Fees Apply to Each Mode?
Air freight involves fuel surcharges that can add 15-30% to base rates, plus security fees and terminal handling charges that vary by airport. Sea freight includes bunker adjustment factors (BAF) reflecting fuel costs, currency adjustment factors (CAF), and terminal handling charges (THC) at both origin and destination ports. Both methods may incur peak season surcharges, with air freight experiencing spikes during holiday periods and sea freight during Chinese New Year and back-to-school seasons. Additional customs brokerage fees and documentation charges apply to both methods, though they're typically higher for air freight due to faster processing requirements.
How Do Inventory Costs Impact Total Expenses?
Inventory carrying costs represent a frequently overlooked component in freight decisions, yet they can dramatically alter the cost comparison between air and sea transportation. These costs encompass capital investment, storage expenses, and risks associated with goods in transit and in warehouse.
The time value of money, storage facility expenses, insurance premiums, and inventory risk factors collectively determine the true cost of maintaining hat inventory throughout the supply chain. These costs behave very differently between fast air shipments and slower sea transport.
What Capital Carrying Costs Should You Consider?
Cost of capital calculations should account for the time value of money during the extended transit times of sea shipping (30-45 days) versus air freight (3-7 days). For a $50,000 hat shipment, the capital carrying cost difference can reach $300-600 monthly based on typical business loan rates or weighted average cost of capital. Sea freight ties up capital 4-6 times longer than air freight, creating significant opportunity costs for that capital in other business areas. The inventory financing cost calculation should include both direct borrowing costs and the potential return from alternative investments of the same capital.
How Do Storage and Handling Costs Differ?
Warehousing expenses typically range from $0.50-1.50 per cubic foot monthly, with sea shipments requiring more storage space due to larger minimum shipment sizes. Inventory service costs including insurance, taxes, and administrative overhead typically add 2-5% annually to inventory value. Handling and labor costs vary significantly, with sea shipments often requiring more handling due to container unpacking and longer storage duration. Risk costs including obsolescence, damage, and pilferage increase with longer storage periods common with sea freight. These inventory carrying cost components typically total 20-30% of inventory value annually when all factors are considered.
What Hidden Costs Affect Total Landed Cost?
Beyond direct transportation and inventory expenses, numerous hidden costs can significantly impact the true cost comparison between air and sea freight. These often-overlooked factors can reverse the apparent cost advantage of either shipping method.
The complete landed cost analysis must include factors like stockout costs, quality issues, compliance expenses, and market responsiveness that don't appear on freight invoices but substantially affect profitability.
How Do Stockout and Obsolescence Costs Compare?
Stockout costs for fashion-forward hats can be substantial, with air freight's speed reducing potential lost sales by 40-60% compared to sea shipments during peak seasons. Obsolescence risk is particularly relevant for seasonal hat collections, where sea freight's longer transit times increase exposure to fashion trend changes and seasonal demand shifts. The cost of markdowns to clear slow-moving inventory averages 25-40% of retail price, with sea-shipped goods facing higher markdown probability due to less responsive replenishment. Carrying cost of safety stock can be 15-25% lower with air freight due to more predictable lead times and faster replenishment cycles.
What Compliance and Quality Risks Exist?
Customs clearance delays average 2-3 days for air freight versus 5-10 days for sea shipments, creating additional demurrage and detention charges. Quality inspection costs often run higher for sea shipments due to greater exposure to moisture damage and container temperature variations during longer transit times. Insurance premiums typically run 0.5-1.0% for air freight versus 1.5-2.5% for sea shipments due to longer exposure and higher damage risk. Compliance documentation costs average 15-25% higher for sea freight due to more complex bill of lading requirements and customs entry procedures.
How to Create an Accurate Cost Comparison Model?
Developing a comprehensive cost comparison model requires structuring calculations to capture all relevant cost components while accounting for business-specific factors. A well-designed model provides actionable insights rather than simple transportation cost comparisons.
An effective cost model incorporates both quantitative financial data and qualitative business factors, allowing for scenario analysis and sensitivity testing across different business conditions and market environments.

What Key Variables Should Your Model Include?
Lead time variability significantly impacts safety stock requirements, with sea freight typically showing 5-10 day variability versus 1-2 days for air. Order cycle time calculations should include total time from order placement to receipt, not just transit time. Minimum order quantities affect both transportation costs and inventory levels, with sea freight often requiring larger batches. Payment term implications should factor in how shipment duration affects cash flow cycles and supplier relationships. These critical variables determine which shipping method optimizes total supply chain costs.
How to Calculate Cost Per Wearable Hat?
The true cost calculation should account for damage rates that average 1-2% for air freight versus 3-5% for sea shipments due to handling and environmental exposure. Quality inspection failure rates typically run higher for sea-shipped goods, requiring larger initial orders to achieve the same sellable quantity. Size and style allocation errors become more costly with sea freight due to longer correction cycles and higher obsolescence risk for mismatched inventory. The cost of customer returns should be factored in, as delayed replenishment via sea freight can increase return rates by 15-25% due to limited size availability. This comprehensive unit cost approach ensures you're comparing actual wearable inventory costs rather than simply transportation expenses.
Conclusion
Calculating the true cost difference between air and sea freight for hats requires analyzing transportation expenses, inventory carrying costs, hidden risks, and market factors. While sea freight typically offers lower per-unit transportation costs, air freight provides advantages in inventory turnover, risk reduction, and market responsiveness that can outweigh the apparent price difference. The optimal choice depends on your specific product characteristics, market position, and business strategy.
The most cost-effective shipping strategy often involves a hybrid approach, using air freight for high-value, fashion-sensitive styles and sea freight for basic, predictable sellers. By implementing a comprehensive cost analysis framework, hat businesses can make informed logistics decisions that optimize total supply chain costs while maintaining market competitiveness and customer satisfaction.